
Beginning in the 1990s, WDFW developed an aerial survey methodology to monitor the abundance, trends, and distribution of marine birds in the Puget Sound and the Strait of Juan de Fuca (U.S. portion of the Salish Sea). Originally, the methodology included both winter and summer surveys, however due to funding limitations, only the winter surveys have continued in recent years.
Surveys are flown each year by a crew of experienced WDFW biologists from early December until the surveys are complete, which is usually by the end of January. The surveys were designed to occur during midwinter, when sea ducks and other marine birds are least likely to be migrating. Flights are conducted at an altitude of 200 feet (61 meters) above the water and at an airspeed of 85-90 knots. Each biologist counts all marine bird and mammal observations within a 50-meter strip along their respective side of the aircraft. The surveys cover the entire shoreline of the inland marine waters of Washington. The offshore waters are sampled by flying a pre-designed zigzag pattern.
Web map
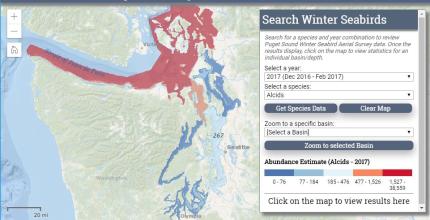
Washington Department of Fish and Wildlife values the use of survey results for wildlife management, local planning, scientific and permitting purposes. The Midwinter Aerial Seabird Survey web map is a mapping tool that allows users to display and plot marine bird abundance results from survey data. This tool draws from two decades of winter seabird aerial surveys conducted by biologists at the Washington Department of Fish and Wildlife for the purposes of seaduck harvest management.
To explore the results from the midwinter aerial surveys, visit the web map:
The web map allows users to query information by species or groups of species, by survey year, and by the entire survey area or specific basins within the Washington state portion of the Salish Sea. The information is divided even further into depth bands (e.g., 0-10 meters deep) because some birds are only associated with the shallow environments while others have a more offshore or deep water distribution.
Results are expressed as the estimated number of birds for the area of interest. Areas with relatively high abundance of birds are expressed in hot (red) colors and areas with relatively low abundance are expressed as cold (blue) colors. The color scale (quantiles) are unique to each species or species group and are based on the abundance of birds across all years of the survey effort.
Graphs are also provided that include abundance estimates by year and population trends across all years for either the entire Puget Sound region or by a selected basin and depth strata. The graph displays the estimates (number of birds) for each survey year and the associated uncertainty for that estimate. The horizontal dashed line is the average number of birds detected across all years and the curving solid gray line, and associated gray shading, is the long-term trend and the uncertainty associated with that trend.
Data access
For access to the underlying data, please visit the open data portal.
Before using the information, please consult Joe Evenson or Kyle Spragens. Appropriate use of the data or analysis requires a detailed understanding of the survey effort and how that effort has changed over time. Not accounting for these details is likely to result in misinterpretation. A great deal of time and effort went into gathering this information, and we ask that you appropriately acknowledge the source of the information. We also ask that you work with WDFW staff to develop a data-sharing agreement prior to analysis and publication.