Image

UPDATE: The 2025 Commercial Puget Sound Surf Smelt Fishery is OPEN. The fishery will be closed by Emergency regulation when the 60,000 pound quota is reached.
General Information:
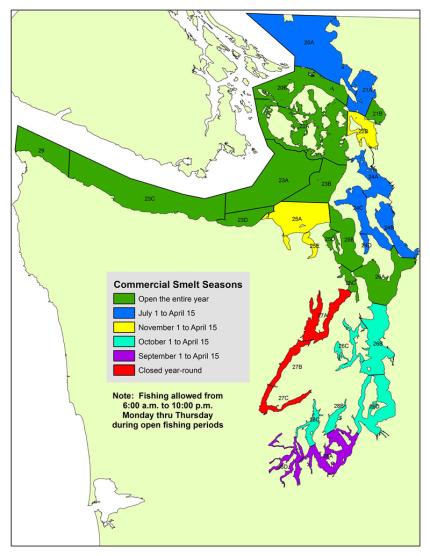
- Use the map on this page to find open areas/dates/times.
- Make your quick reports by 2 p.m. the day after landing to smeltreport@dfw.wa.gov or 844-611-3822.
- The fishery will close by emergency regulation when the 60,000-pound quota is reached.
- Questions about Surf Smelt Fisheries in Puget Sound? Contact Phill Dionne at phillip.dionne@dfw.wa.gov.
- If you are looking for information about Eulachon (Columbia River Smelt) in the Lower Columbia or Cowlitz Rivers, please contact the Region 5 Office at TeamRidgefield@dfw.wa.gov or 360-696-6211
- More Info can also be found in our monthly Weekender Report.
Regulations
A commercial fishery for smelt is allowed in Puget Sound waters using drag (beach) seine gear with area, timing, and gear restrictions.
Regulations on commercial fishing for smelt in Puget Sound include:
- An annual quota of 60,000 pounds.
- Openings from 6 a.m. to 10 p.m. Monday through Thursday during seasonal openings in each area.
For more information, see:
- 220-356-050 Puget Sound forage fish commercial fisheries—General provisions
- 220-356-060 Puget Sound herring, anchovy and smelt commercial fisheries—Drag seine
- 220-356-070 Puget Sound herring and anchovy commercial fisheries—Purse seine
- 220-356-080 Puget Sound herring and anchovy commercial fisheries—Dip bag net
- 220-356-190 Puget Sound smelt commercial fishery—Seasons
- 220-356-200 Puget Sound smelt commercial fishery—Weekly periods
If needed, an emergency regulation will be enacted when the annual commercial fishery quota is expected to be reached.
2025 Landings
- Annual quota: 60,000 pounds
- Total landed: 44 pounds
- % of Quota: 0.07%
| Month | Landings (in pounds) |
|---|---|
| January | 0 |
| February | 0 |
| March | 11 |
| April | 33 |
2024 Monthly Landings
| Month | Landings (in pounds) |
|---|---|
| January | 0 |
| February | 0 |
| March | 0 |
| April | 0 |
| May | 0 |
| June | 0 |
| July | 12564 |
| August | 17220 |
| September | 10322 |
| October | 6666 |
| November | 578 |
| December | 0 |
| Total | 47,350 |
Annual Landings
| Year | Landings (in pounds) |
|---|---|
| 2014 | 57,669 |
| 2015 | 60,263 |
| 2016 | 60,824 |
| 2017 | 60,092 |
| 2018 | 57,675 |
| 2019 | 60,124 |
| 2020 | 30,876 |
| 2021 | 25,066 |
| 2022 | 4,998 |
| 2023 | 32,702 |
| 2024 | 47,350 |