
Since 2001, WDFW along with our partners have been monitoring marbled murrelets under the Northwest Forest Plan Effectiveness Monitoring Program. Murrelet monitoring is an interagency cooperative effort.
We monitor marbled murrelet population size and trends by annual sampling of populations in near-shore waters, using a standardized, boat-based line transect method. WDFW biologists monitor the inland waters (Puget Sound and Strait of Juan de Fuca) and coastal waters of Washington in alternating years using a stratified random survey design.
Surveys are conducted between 15 May and 31 July. Details of our survey and analytical methods can be found in this publication.
Webmap
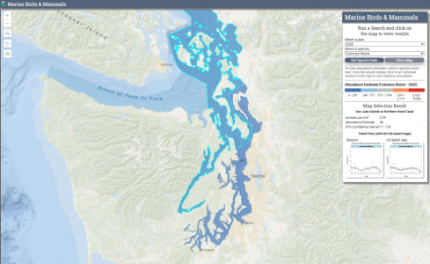
The Spring/Summer marine bird and mammal surveys webmap is a mapping tool that allows users to query and display marine bird abundance results by species for each survey year. Results, expressed as estimated number of animals and density (animals/km2), can be explored for the entire survey area (Puget Sound and Strait of Juan de Fuca) and for each of three strata: 1) Strait of Juan de Fuca, 2) San Juan Islands to Northern Hood Canal, and 3) Central and Southern Puget Sound.
While monitoring murrelets we also record other species detected. To explore survey results for local breeding seabirds and the harbor seal and harbor porpoise, visit the webmap.
Areas with relatively high abundance of birds/mammals are expressed in hot (red) colors and areas with relatively low abundance are expressed as cold (blue) colors. The color scale (quantiles) are unique to each species or species group and are based on the abundance across all years of the survey effort.
Graphs are also provided that include density estimates by year and population trends across all years for either the entire Puget Sound and Strait of Juan de Fuca region or by strata. Each graph displays the density estimates for each survey year and the associated uncertainty for that estimate. The horizontal dashed line is the average number of birds detected across all years and the curving solid gray line, and associated gray shading, is the long-term trend (Loess curve weighted by the standard error) and the uncertainty associated with that trend (95% Confidence interval).
Data access
For access to the underlying data and summary results used in the webmap, please visit the open data portal.